Code
import numpy as np
x = np.random.normal(size=100)
import matplotlib.pyplot as plt
plt.hist(x)
plt.show()
np.mean(x)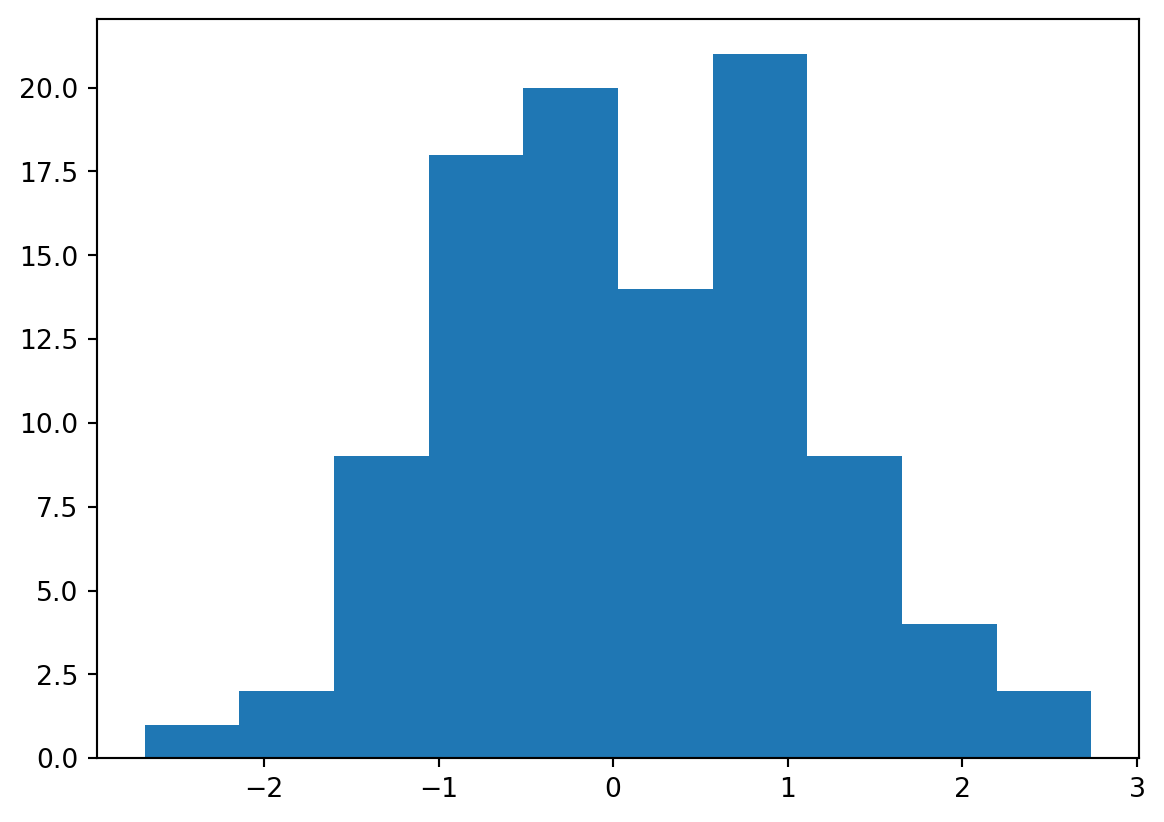
np.float64(-0.02957677078643928)[UNDER CONSTRUCTION]
This is an example of using qmd as the source document with pdf as one target. I’ve taken out the qmd stuff that doesn’t seem to render to pdf.
import numpy as np
x = np.random.normal(size=100)
import matplotlib.pyplot as plt
plt.hist(x)
plt.show()
np.mean(x)
np.float64(-0.02957677078643928)\[ \theta = \int_0^\infty f(x,\theta)d\theta \]
Warning: having
include-before-bodyin the yaml header of this file, as seemingly needed to enable macros, causes extra space at top of page.
\[ A = X \trans Y \]